DNA-Entropy-Graph

C#WinUI 3PythonEvo 2Google Cloud

Drop in a GenBank or FASTA file, or paste a sequence, and DNA-Entropy-Graph runs the Evo 2 genomic language model on a GPU that belongs to you, then hands back a per-base Shannon entropy track, a number from 0 to 2 bits at every position, that opens in IGV, Geneious, SnapGene or Benchling. There are two ways to run it. If the machine has an NVIDIA card with 24 GB or more, the work stays there and the sequence never leaves the desk. Evo 2 is CUDA only, so that is the bar. If the machine cannot meet it, the app rents a GPU inside your own Google Cloud project, which you are billed for and which is deleted when the run ends. Either way, nobody involved with this project can see your account, your files or your bill.

Researchers in a lab at Vanderbilt University Medical Center already use the command-line prototypes this succeeds, and their PI greenlit this app to replace them. Where it stands today: the science package runs and its own test suite passes, the Windows app around it is still being built, and there is no installer yet. I am not going to show a screenshot of an app whose viewer still renders glitched, so the plate below draws the one design decision that actually matters, that whichever of the two GPUs you pick, no server of mine sits anywhere between your sequence and your result.

Diagram: the bring-your-own-GPU flowA sequence file starts on the researcher's own machine, and the flow then divides into two compute options. On one, the file stays on that same machine and Evo 2 runs on a discrete GPU inside it, so nothing leaves the machine. On the other, Evo 2 runs on a GPU rented inside the researcher's own Google Cloud project, shown inside a dashed boundary labelled as that project, and the rented machine is deleted once the run ends. The two options rejoin, and either way the resulting entropy track returns to the same machine, to open in IGV, Geneious, SnapGene or Benchling. No server belonging to the developer sits in either path.YOUR MACHINESEQUENCE INGenBank orFASTA fileTHE SAME MACHINELOCAL GPUEvo 2 runs herenothing leaves the machineORYOUR GOOGLE CLOUD PROJECTRENTED GPUEvo 2 runs heredeleted when the run endsYOUR MACHINEENTROPY TRACKIGV · Geneious ·SnapGene · BenchlingNo server of mine is in either path.Diagram: the bring-your-own-GPU flowA sequence file starts on the researcher's own machine, and the flow then divides into two compute options. On one, the file stays on that same machine and Evo 2 runs on a discrete GPU inside it, so nothing leaves the machine. On the other, Evo 2 runs on a GPU rented inside the researcher's own Google Cloud project, shown inside a dashed boundary labelled as that project, and the rented machine is deleted once the run ends. The two options rejoin, and either way the resulting entropy track returns to the same machine, to open in IGV, Geneious, SnapGene or Benchling. No server belonging to the developer sits in either path.YOUR MACHINESEQUENCE INGenBank or FASTA fileTHE SAMEMACHINELOCAL GPUEvo 2 runs herenothing leavesthe machineORYOUR GOOGLECLOUD PROJECTRENTED GPUEvo 2 runs heredeleted when therun endsYOUR MACHINEENTROPY TRACKIGV · Geneious ·SnapGene · Benchling

PLATE I.

Sequence in, then either a GPU in your own machine or one rented inside your own Google Cloud project, entropy track back. No server of mine sits in either path.

DNA-Entropy-Graph results
MeasurementResultSource
Worker pipeline, stand-in predictor810 passed, 2 skippedDNA-Entropy-Graph README.md, Where it stands table
App shell, run history, run progress327 tests, 0 failing, 1 skippedDNA-Entropy-Graph README.md, Where it stands table

GitHub

Engineering-Identity

Pythonscikit-learnXGBoostLightGBMTensorFlow

I led the 30-person research team behind this study at UT Dallas, Aug 2024 to Jun 2025, roughly 1,900 students, and rebuilt the pipeline that predicts a first-year engineering student’s composite Engineering Identity score. The headline finding is a replication audit, not a score: several of the original results did not reproduce, and a plain regularized model, elastic net or a stacked ensemble, beats the original neural network in every protocol I ran.

The predictions come from start- and end-of-semester surveys, three written definitions of an engineer, and a hand-drawn concept map turned into graph-complexity metrics. Removing seven proxy survey items that shadow the target formula drops the best model’s R^2 from 0.417 to 0.294, the single largest effect in the study, and predicting genuine before-to-after change tops out at R^2 = 0.115: most of what looks like predictable identity change is really a persistence effect, the student already had a stable score.

I also automated pieces of the data pipeline the team ran by hand: keyword and synonym detection across 27,000+ open-ended definitions, and error detection over 9,000+ concept maps, which saved the team 500+ hours of manual review.

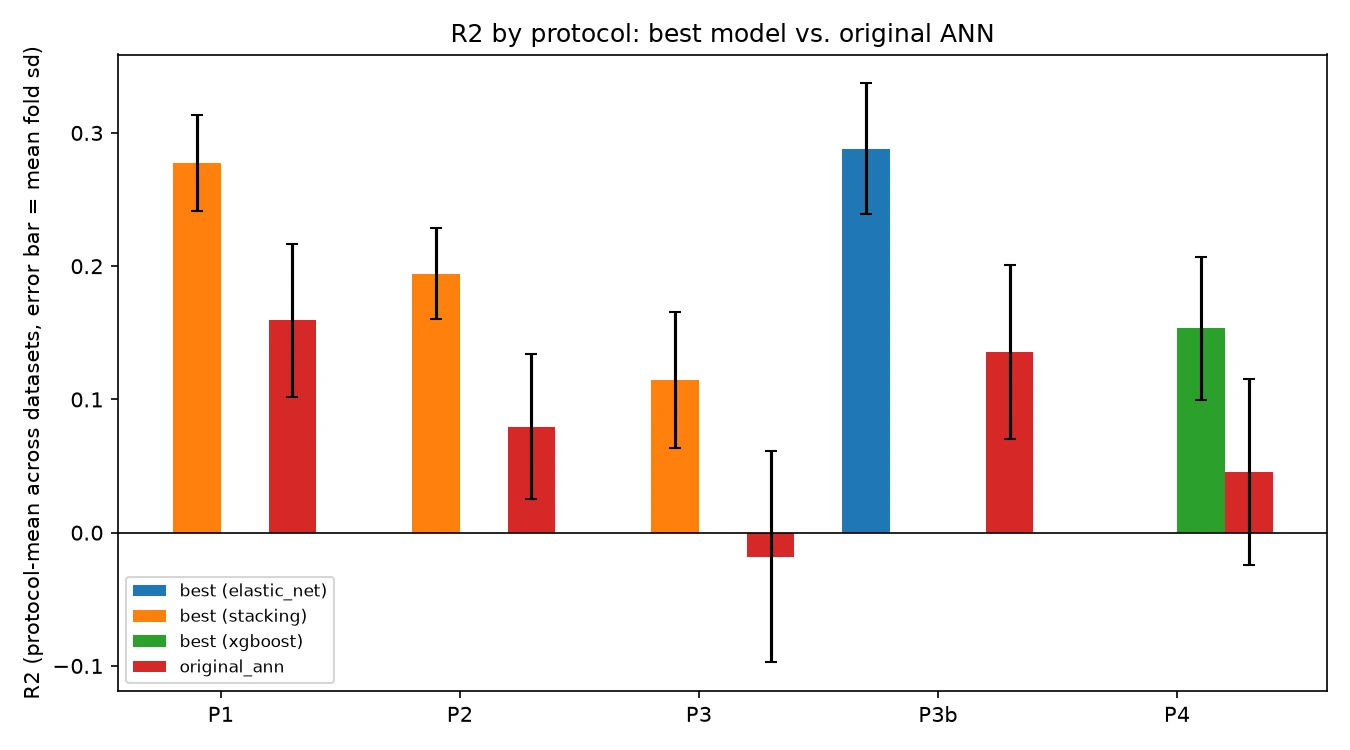
Grouped bar chart of R^2 by protocol, best model in this repo versus the original neural network, with error bars. The best model, orange or blue or green depending on protocol, leads the original network, shown in red, in every one of the five protocols: P1, P2, P3, P3b and P4.

PLATE II.

R^2 by protocol, averaged over the datasets inside each protocol: the best model in this repo against the original network, on the same cross-validation folds. The table below quotes the strongest single dataset in each protocol, so several of its figures sit above these bars.

Engineering-Identity results, best model against the original network, strongest dataset in each protocol
MeasurementResultSource
P1 replicationstacking 0.417 +/- 0.040, ANN 0.281 +/- 0.027README.md, R^2-by-protocol table
P2 no proxy itemsstacking 0.294 +/- 0.030, ANN 0.186 +/- 0.029README.md, R^2-by-protocol table
P3 true predictionstacking 0.115 +/- 0.051, ANN -0.018 +/- 0.079README.md, R^2-by-protocol table
P3b persistence baselineelastic net 0.288 +/- 0.049, ANN 0.136 +/- 0.065README.md, R^2-by-protocol table
P4 concept-map cohortxgboost 0.133 +/- 0.045, ANN -0.011 +/- 0.059README.md, R^2-by-protocol table

GitHub

Zero-Shot-Variant-Effect

PythonPyTorchTransformersHyenaDNANucleotide Transformer

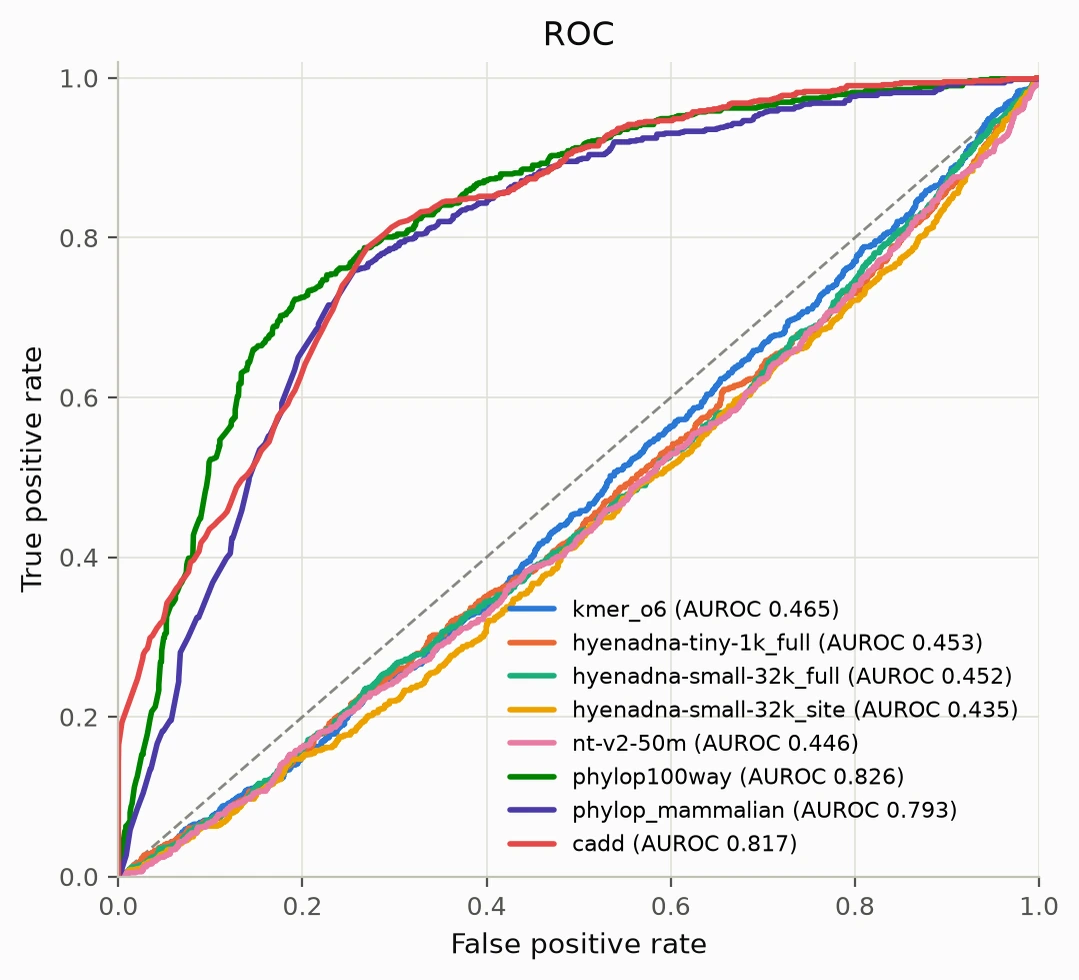
I wanted to know whether DNA language models small enough to run on a laptop CPU can predict variant effects with no training, by scoring each variant on the likelihood ratio between its alt and ref sequence. On the BRCA1 saturation genome editing set, 3,644 SNVs from Findlay et al. 2018, the answer is no: HyenaDNA and Nucleotide Transformer v2 land at or below chance while a plain phyloP conservation score reaches 0.826 AUROC. That is the interesting part of this project, and I am presenting it as a negative result rather than dressing it up.

Both models pass positive controls first, recovering masked bases far above chance and preferring real sequence over a shuffled control, so this is not broken code. Their likelihood ratios simply carry almost no measurable conservation signal at this locus, Spearman correlation with phyloP under 0.03 in either direction, which is a finding about what these small, CPU-sized models learn from unlabelled sequence, not a bug in how I scored them.

Zero-Shot-Variant-Effect results, BRCA1 saturation genome editing, 3,644 SNVs, 95% bootstrap intervals
MeasurementResultSource
phyloP 100-way (not zero-shot)AUROC 0.826 [0.809, 0.841]README.md, BRCA1 results table
CADD (supervised, not zero-shot)AUROC 0.817 [0.801, 0.831]README.md, BRCA1 results table
order-6 Markov modelAUROC 0.465 [0.442, 0.488]README.md, BRCA1 results table
HyenaDNA small, 32kAUROC 0.452 [0.430, 0.474]README.md, BRCA1 results table
Nucleotide Transformer v2AUROC 0.446 [0.426, 0.466]README.md, BRCA1 results table

GitHub